Immigrant Support Atlas
Immigrant and refugee support across the United States
The atlas is for immigrants and refugees and for the practitioners who work with them. It lists 15,919 nonprofits that serve them and measures access to those organizations and to mental health care. It also provides summary statistics on the immigrant population of every state, county and city from Census data, and our chatbot assistant answers questions about any of it in any language.
You do not need to say who you are, and this map does not ask about immigration status. It works the same whether you are looking for yourself or helping someone else.
Directory
Organizations in Detroit, MI33
COMMUNITY HEALTH AND SOCIAL SERVICES CENTER
DETROIT COMMUNITY HEALTH CONNECTION
FREEDOM HOUSE DETROIT
GLOBAL DETROIT
Local statistics
Ann Arbor, Michigan
18.7%of residents were born in another country (22,630 people)
Limited-English speakers by language
Access map
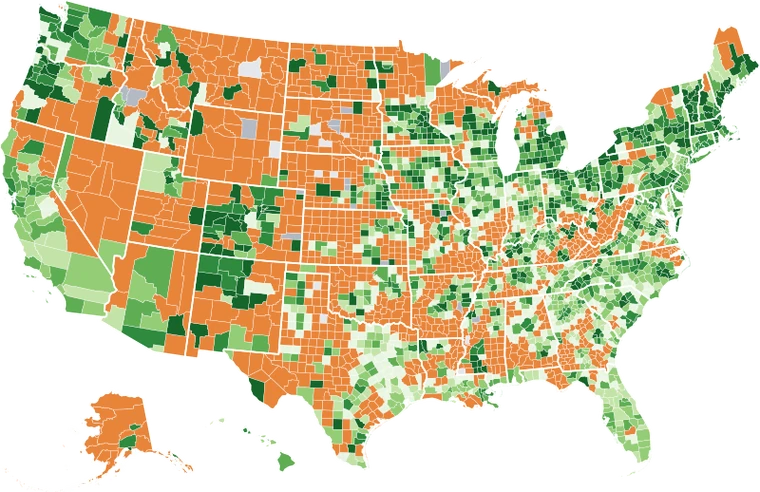
FewerMoreService desertNot scored
Organizations within 30 miles, per 100,000 residents born abroad
Mental health access
Share of limited-English speakers with no therapist in their language within 30 miles
Private practice directory listings, by road distance within each state
Help by need
About the data
Organization census
15,919 nonprofits that serve immigrants and refugees, drawn from IRS exempt-organization records, Form 990 program text and federal and network directories. Services and languages are coded from each organization's own website and from public registries.
MethodsPopulation statistics
Population, language and country-of-birth figures for every state, county, metro area and city come from the Census Bureau's American Community Survey (2023 five-year estimates), with yearly trends from 2009.
StatisticsAccess measures
Access scores use the enhanced two-step floating catchment area method on OpenStreetMap roads. Each organization or provider within 30 miles, or 10 miles for people without a car, is shared among the people who need it, and nearer ones count more.
Access mapDownloads
The mental health access index for states, counties, metro areas, places and census tracts is on openICPSR with its codebook and code. The organization dataset is being prepared for release with its data descriptor.
doi:10.3886/E249915More in the atlas
Support system for newcomers
Newcomers are served by a patchwork of programs, many tied to federal funding streams:
- Refugee resettlement: first months after arrival, through the Office of Refugee Resettlement and its Reception & Placement agencies.
- Immigration legal aid: asylum, green cards, citizenship, from a licensed attorney or a DOJ-accredited representative (find one via the National Immigration Legal Services Directory).
- Health & mental health: community health centers (HRSA) serve patients regardless of immigration status or ability to pay.
- Community & ethnic organizations: English classes, case management, and cultural connection.
These are the main streams; in this dashboard every organization is tagged with the specific services it actually offers (27 categories, from legal aid and ESL to mental health, benefits enrollment, employment, and more), so you can filter the map and directory to exactly what someone needs.
Key terms
- Foreign-born: anyone not a US citizen at birth (includes naturalized citizens, green-card holders, refugees, and the undocumented).
- LEP (limited English proficiency): speaks English less than “very well”.
- Refugee / asylee: granted protection from persecution (abroad vs. at the border).
- Naturalized: a foreign-born person who became a US citizen.
- Diversity (Shannon H): higher = more languages or origins mixed together.
- Segregation (dissimilarity): 0 = foreign- and US-born evenly spread, 1 = fully separated across neighborhoods.
- Spatial access (E2SFCA): organizations within reach relative to the population that needs them (Access map); higher = better geographic access.
- Service desert: an area where people need a service but no organization offering it is within reach.
- Immigrant Policy Inclusion Index: a state’s inclusive immigrant-specific policies minus restrictive ones, across health, language, education, ID, and legal protection (Policy map).
- Immigrant–Native Disparity Index: standardized foreign-born vs US-born gaps on outcomes like insurance, housing, income, and digital access (Disparity map).
About the map categories
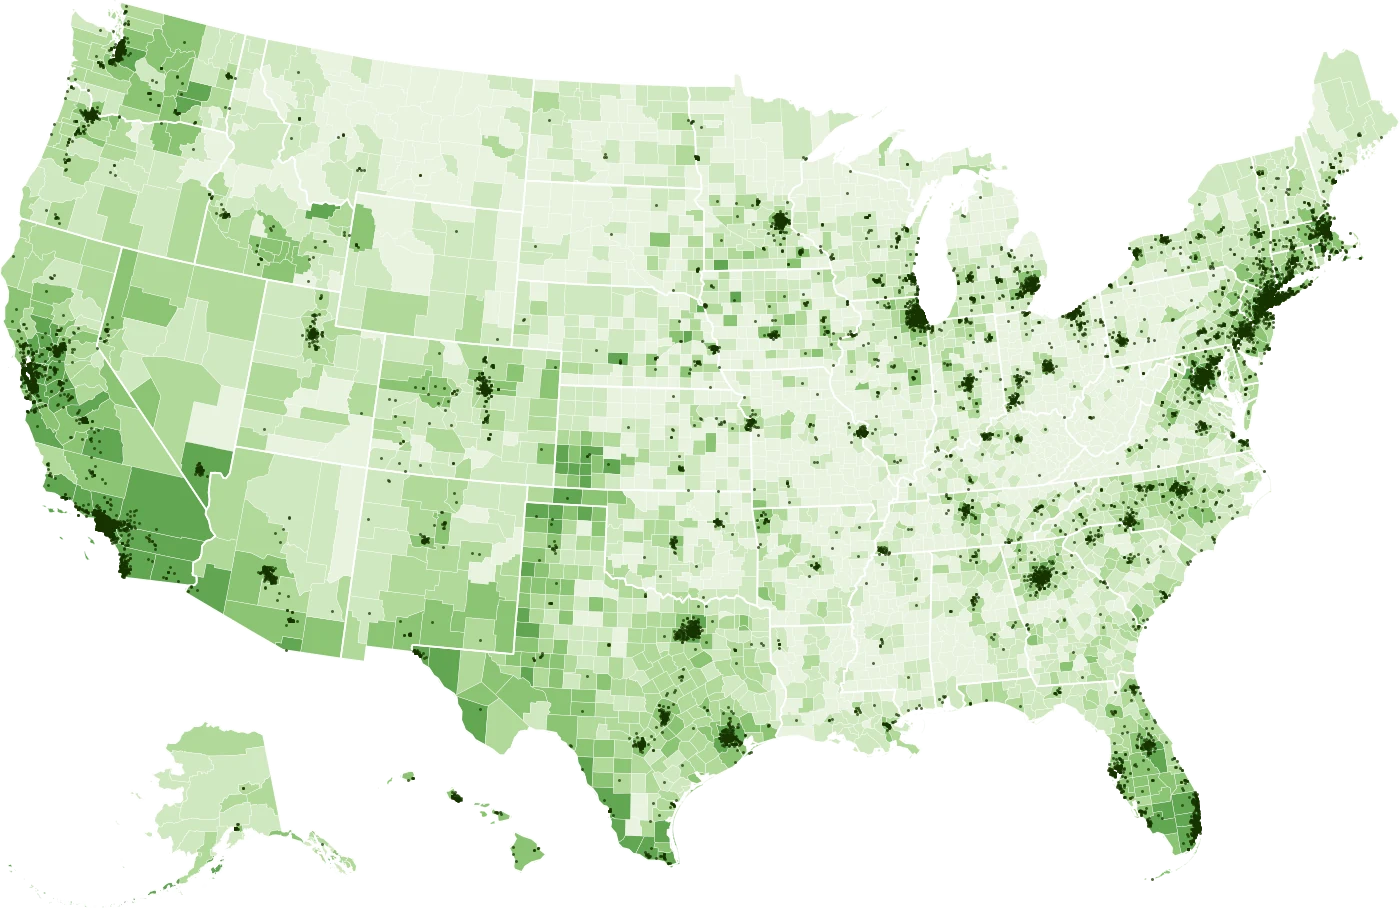
Each dot is one organization, colored by what it primarily does. The shaded background shows the foreign-born share of each county, so you can see supply (dots) against need (shading).
- Legal / immigration, Citizenship: asylum, green cards, removal defense, naturalization.
- Refugee resettlement: arrival reception, case management, cultural orientation.
- ESL / English, Education: language classes and youth programs.
- Health, Mental health: clinics and counseling, often sliding-scale.
- Ethnic community, Advocacy, Faith-based, Employment, Housing: by-and-for community support, policy, and basic needs.
Coverage note: a service tag is coded for 97% of listings and a service language for 56%, so a missing language tag usually means the organization does not state one on its website.
About this project
Created and maintained by Nari Yoo, PhD, University of Michigan School of Social Work. The underlying dataset is being prepared for publication as a data descriptor, “Service and Language Access Profiles of U.S. Immigrant- and Refugee-Serving Nonprofits: A National Geocoded Dataset Augmented with Large Language Models.” Built with open web data and the U.S. Census American Community Survey. For collaboration or data-access inquiries, contact nariyoo@umich.edu.
Foreign-born share over time
How the immigrant share of the population shifts across the country. Press play to animate. Source: US Census ACS 5-year.
Access to immigrant-serving organizations
Spatial access by the enhanced two-step floating catchment area method (E2SFCA). Darker green = better access; orange = a service desert (people who need it, but no organization within reach); gray = no foreign-born population. Source: org locations + US Census ACS 2023.
Immigrant Policy Inclusion Index
How inclusive each state’s policies are toward immigrants, across seven domains: health coverage, language access, higher education, identification, integration & licensure, legal protection, and economic inclusion. Darker green = more inclusive; orange/red = more restrictive or limited. Click any state for its full profile.
Immigrant–Native Disparity Index
Standardized gaps between foreign-born and US-born residents (uninsured, crowded housing, rent burden, education, home internet, vehicle access, homeownership) from US Census ACS. Green = smaller gaps; red = larger gaps. This is an outcome measure, separate from the Policy map: it describes how immigrant and US-born residents differ, and is shaped by who has immigrated where (recency and composition), not by state policy alone. Click any state for its full profile.
English assimilationism
Project Implicit is a self-selected volunteer sample, not a representative survey; within each area, respondents are reweighted to the Census population by age, sex, race and ethnicity, and citizenship. Higher = less welcoming. Areas with too few respondents are left blank. See the note below for the exact survey item. Source: Project Implicit 2023-2025.
Immigrant attitudes
Project Implicit is a self-selected volunteer sample, not a representative survey; within each area, respondents are reweighted to the Census population by age, sex, race and ethnicity, and citizenship. Higher = less welcoming. Areas with too few respondents are left blank. See the note below for the exact survey item. Source: Project Implicit 2023-2025.
Immigrant profiles by origin, language, and race / ethnicity
Pick a group to see its own profile: how large it is and how it lives, with the all-foreign-born and US-born averages shown for context. National estimates from US Census ACS 1-year microdata (PUMS).
About & data construction
Created and maintained by Nari Yoo, PhD, University of Michigan School of Social Work.
The underlying dataset is being prepared for publication as a data descriptor: “Service and Language Access Profiles of U.S. Immigrant- and Refugee-Serving Nonprofits: A National Geocoded Dataset Augmented with Large Language Models.”
Collaboration and data-access inquiries are welcome: nariyoo@umich.edu.
Why this dashboard exists
Immigrants and refugees in the United States depend on a dispersed patchwork of nonprofit organizations for legal aid, resettlement, English classes, health and mental health care, and basic needs. There has been no national, openly available map that identifies these organizations, describes what each one actually does, and records whether they can serve people in languages other than English. Administrative records cannot answer these questions on their own: the IRS classification system undercounts immigrant- and refugee-serving organizations and is silent on the services they deliver and the languages they use (Gleeson & Bloemraad, 2013). The inventories that do exist tend to cover a single domain, such as immigration legal services, or rely on hand coding that does not scale to the whole country.
This project addresses those gaps. It assembles a national, geocoded census of immigrant- and refugee-serving nonprofits from IRS records, Form 990 program text and federal and sector directories, and screens every candidate with a panel of language models reading the evidence that candidate actually has. A language-model layer then reads each organization’s website to tag the specific services it offers and to audit its language access, separating genuinely multilingual sites with professionally translated content from those that only add an automatic-translation widget, and recording the languages each organization states it serves. Producing these organization-level service and language-access measures at national scale is the dataset’s distinctive contribution; they are not derivable from administrative data and have not previously been compiled into a single open resource.
The supply side is then placed next to demand. Each organization is linked to Census American Community Survey measures of the foreign-born population, its growth over time, and limited-English proficiency by language, at the state, county, city, and metropolitan level. Seeing provision and capacity alongside where immigrants live and which languages they need makes it possible, for any place in the country, to identify both who provides help and where the gap between need and available, language-accessible help is widest.
It is built for three audiences. Newcomers and the people who assist them can see what resources exist in a new place, identify the organizations that provide a specific service, and use the directory to make referrals in the language a client needs. Practitioners and funders can see where coverage is thin relative to need. Researchers and policymakers get a reproducible, openly documented dataset that links the immigrant nonprofit sector to local linguistic demand.
The dashboard now extends beyond the directory. The Access map measures spatial access to organizations, and to public (SAMHSA) and private (a private practice directory) mental-health care, with a two-step floating catchment method, by language, for households without a car, and for providers that accept Medicaid. The Policy map carries a state Immigrant Policy Inclusion Index (immigrant-specific inclusive minus restrictive laws across health, language, education, identification, and legal protection), and the Disparity map shows a companion Immigrant-Native Disparity Index of foreign-born versus US-born outcome gaps. A Language access guide explains the right to free interpreting and translation in health and mental-health care, and a grounded assistant answers questions from the underlying data.
Data coverage & how to read it
Loading coverage figures…
A national directory and dashboard of US nonprofit organizations serving immigrants, refugees, asylees, and other foreign-born newcomers, paired with Census foreign-born, language-need, and immigrant social/economic context at state, county, and city levels.
How the organization list was built
- IRS frame. Exempt Organizations Business Master File (NTEE codes P84 Ethnic & Immigrant Centers, Q71 Refugee Issues) as the high-precision core.
- Form 990 text signals. NCCS efile mission/program text searched for immigration-status keywords AND ethnic/national-origin community terms, in both organization names and text (a two-by-two net).
- Federal/recognized directories. ORR refugee resettlement (R&P agencies including the national networks such as Church World Service, the RPC affiliate roster, and the Refugee/Targeted Assistance, Preferred Communities, Matching-Grant and Unaccompanied-Children subprograms via USASpending); USCIS citizenship grantees; DOJ EOIR-recognized and CLINIC / Immigration Advocates Network immigration-legal providers; NCTTP & SAMHSA mental health (with language fields); HRSA health centers; DOL NFJP farmworker programs; DOJ OVC trafficking-victim and OVW culturally-specific victim services; the Welcoming America affiliate network; and NAKASEC community affiliates.
- Screening. Every candidate for which evidence existed was read by a panel of three open-weight language models, each answering the same prompt on the same evidence with include, maybe, or exclude, and a model voting to exclude had to name a ground from a fixed list. Unanimity was required either way, and a split panel returned maybe. A fourth and larger model was then put to the organizations the panel had left at maybe, using the panel’s own instrument unchanged. Dormancy, authoritative federal rosters, and a restriction to the fifty states and the District of Columbia apply to the whole frame afterwards. How much of the population is missing is not estimated; see the Methods page.
- Websites and attribution. A web address comes from the organization’s own Form 990, from a grounded web search that may only choose among the links the search returned, or from an agentic loop that reads pages, follows aggregator listings, and abstains when it cannot tell a local chapter from the national body. The page becomes evidence for that organization only when a fact it filed with the IRS appears on it, through one of ten channels each measured against matched controls before adoption. Services, communities served, languages served, and the website language-access reading (human-authored in-language content, an auto-translate widget, English only, or a widget that errors) are taken from a page admitted that way or from the organization’s own Form 990. Nothing read at an unproven page is published.
Demand-side data (US Census ACS 5-year, 2023; trends 2009–2023)
Every demographic figure is foreign-born specific and available at state, county, city, and metro levels, with US, Census-region, and state averages shown as benchmarks. Time-series (2009–2023 / 2011–2023) cover foreign-born share, language need by language, immigrant and racial/ethnic diversity, and residential segregation.
- Foreign-born population and share; non-citizens, naturalized citizens, recent arrivals (period of entry).
- Granular language need by 43 language groups (ACS B16001: e.g. Hindi, Punjabi, Nepali, Persian/Dari, Amharic/Somali, Swahili, Yoruba/Igbo, Armenian) and English proficiency; limited-English households.
- Country of origin (top countries per place); immigrant-origin and racial/ethnic diversity (Shannon index).
- Foreign-born vs US-born gaps: poverty, health-insurance coverage, median income, median age, education, children with an immigrant parent.
- Well-being by nativity from ACS PUMS microdata (dimensions with no published nativity cross-tab): internet and computer access, SNAP, Medicaid, disability, homeownership, vehicle access, housing cost burden, crowding, and education.
- An Access map measuring spatial access to organizations (E2SFCA) overall, by service domain, and by language, flagging service deserts; a separate mental-health access layer (SAMHSA facilities and therapists in a private practice directory, overall and by language) uses road-network driving distance at every geographic level.
- Residential segregation (foreign- vs US-born dissimilarity and isolation) from census-tract data.
Coverage and limitations
Loading coverage statistics…
Sources & links
- IRS Tax-Exempt Organization Search bulk data irs.gov
- NCCS (Urban Institute) 990 efile nccs.urban.org
- US Census ACS census.gov/acs
- Federal & network directories: ORR / Refugee Processing Center, USCIS, DOJ EOIR, DOJ OVC & OVW (victim services), CLINIC, Immigration Advocates Network (legal services directory), HRSA, SAMHSA, DOL, USASpending.gov, Welcoming America, NAKASEC
- Language-access instrument (open source) github.com/nariyoo/langaccess. The full construction pipeline is released with the dataset paper; see the Methods tab for the procedure.
General educational information only, not legal, medical, immigration, or mental-health advice; using it creates no attorney-client or provider-patient relationship. Compiled from public sources and may be incomplete or out of date, so verify with the official source before relying on any listing. Outside links are for convenience and do not imply endorsement, and individual providers are not vetted. Provided “as is,” without warranty. © 2026 Nari Yoo. Data CC BY 4.0.